Nosis’ mission statement literally includes the words ‘the fund experience your members would go all in for’. This constitutes a philosophical minefield. What is your definition of ‘all in for?’ What counts as the defining fund experience worthy of your clients? This choice of words was no mistake and grandiose half-promise, but rather a guarantee of our willingness to adapt and evolve to your needs. For all prospective clients, Nosis’ can and will rise to the occasion as is the case with QAV.
QAV is considering using Nosis and they are already with a competitor. For Nosis to be the fund that QAV’s users would go all the way in for, we would need to implement the CAGR method of calculating asset performance, a method employed by QAV’s current fund analysts. CAGR was unfamiliar to the team, though as implied in our mission statement, this would not be an excuse to back down. Our new data analyst Boffin was tasked with solving the problem and produced a CAGR chart that looked suspiciously very different from the one that our competitor had made for them.
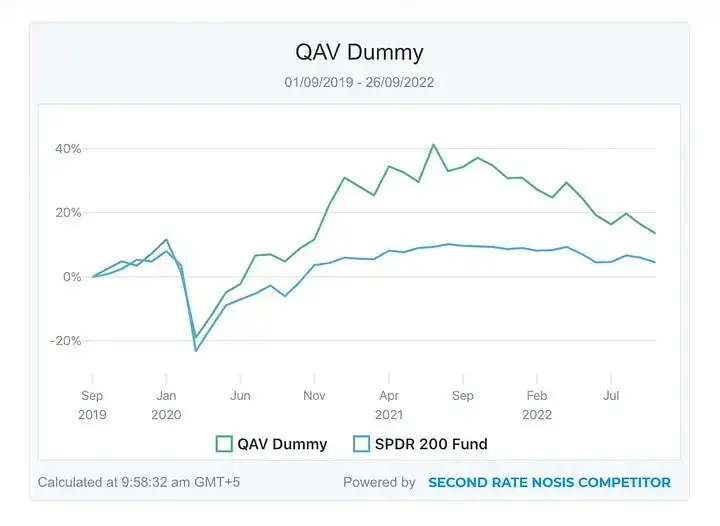
What Boffin had uncovered is a classic ruse. What had been touted as a CAGR chart was simply a run-of-the-mill ‘absolute performance chart’. To uncover this treachery, the team worked backward, manually sorting through hundreds of QAV’s transactions to find the initial balance which had been missing from the first report, an example of the lengths the Nosis team is willing to go to solve a problem. In so doing, Nosis was able to piece together the vast puzzle that is CAGR Charting and create a real, viable CAGR chart for QAV.
With a thorough knowledge of CAGR charting, the team is now able to implement this feature for all users of NOSIS…when the timing is right. In the meantime, we have a tonne of exciting feature drops in the pipeline with the next drop being non-custodial portfolio replication. Keep your eyes peeled for announcements in the coming weeks. For those unfamiliar with CAGR, read on for a bit more of an in-depth deep dive.
What is CAGR?
CAGR is an abbreviation for “Compound Annual Growth Rate.” In essence, it is a method for measuring the growth of an investment over time, accounting for the compounding effect of interest and dividends. The CAGR formula is utilized to reduce the volatility of investment returns, making it a valuable tool for evaluating various assets. While CAGR does not forecast future returns, it can be used to determine which assets performed well in the past and which may be more likely to do well in the future. When examining the CAGR of an investment, it is essential to examine the time span chosen. In general, a shorter time term will result in a greater CAGR, whereas a longer time span will demonstrate a more stable growth rate.
CAGR from Nosis
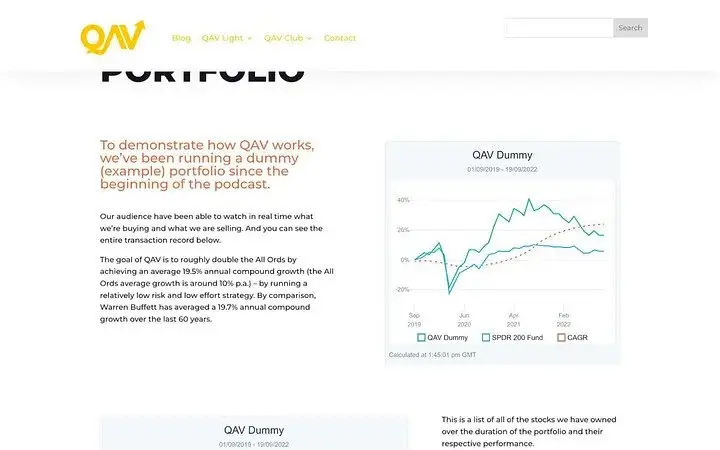
One of our clients had used a competitor for their CAGR chart and was not happy with the results. They came to us wanting to get the chart fixed, and we were more than happy to help. We were able to quickly and easily fix the chart, and our client was very pleased with the results. We are always happy to help our clients get the best possible results.
At Nosis, we are constantly exploring innovative ways to provide the most accurate information to our clients. We will expand our selection of CAGR charts to include more unique possibilities in the future. We feel that this will enhance our client’s understanding of their financial portfolios. In addition, we will provide CAGR charts that can be modified to meet unique requirements. We feel that this will be a useful resource for our clients, and we are dedicated to offering the highest quality service.


